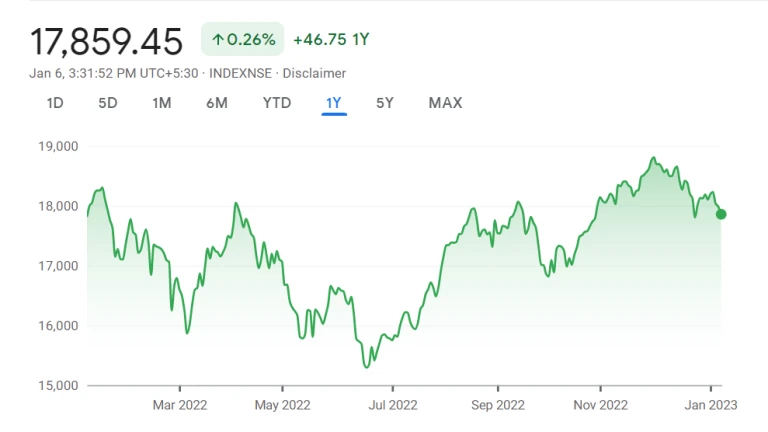
Review of NSE’s Performance in 2022

Contrary to the previous year, the main indices, the NSE’s performance and that of Sensex, have outperformed the broader markets, such as Mid and Smallcap, so far this year. With a small increase of over 4 and 0.5%, respectively. In 2022, both BSE Mid and Small Cap had turned positive in the trade. As of December 14, 2022, the leading indices, NSE’s performance via Nifty50 and BSE Sensex, have each increased by about 6% year-to-date (YTD). Read more about it here!
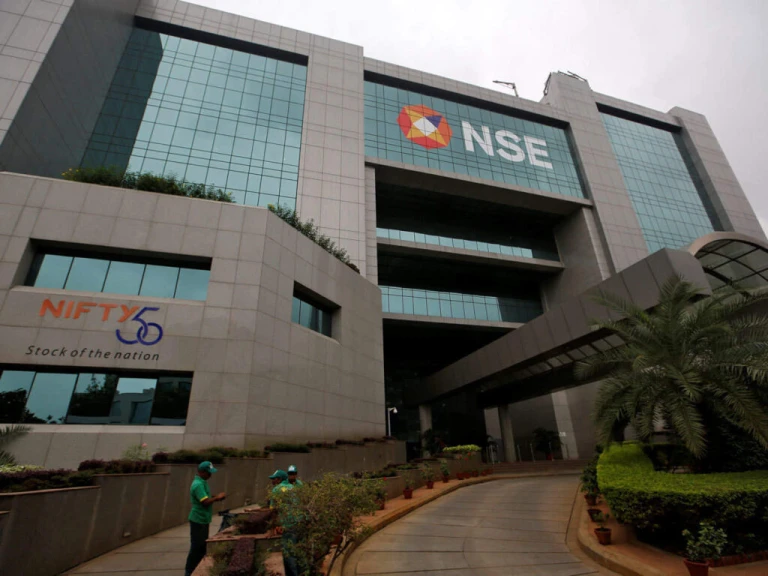
What is NSE?
The main financial market in India is the National Stock Exchange of India Limited (NSE). The NSE, which was founded in 1992 and is now a sophisticated electronic market that ranks fourth globally in terms of equities trading volume, has grown since its incorporation. The wholesale debt market was introduced in 1994, and shortly after that, a cash market component.
The wholesale debt, equity, and derivative markets are now transacted on by the National Stock Exchange of India Limited (NSE). The NIFTY 50 Index, which measures the biggest assets in the Indian equities market, is one of the more well-known options. Exchange-traded funds (ETFs), such as the iShares India 50 ETF, are available to US investors who want to access the index (INDY).
The first exchange in India to offer contemporary, fully automated electronic trading was the National Stock Exchange of India Limited. To increase the openness of the Indian capital market, a consortium of Indian financial institutions established it.
Expert Opinions
The opinions we compiled from various experts on the performance of the larger markets in 2022 are as follows:
Expert: Apurva Sheth, Head of Equity Research, Samco Securities:
With a 4% positive return, mid-caps shown resiliency, demonstrating that investors’ risk appetite hasn’t totally changed and they’re still willing to tolerate some uncertainty. However, market participants struggled with trepidation when it came to buying small-cap indices.
Given the segment’s high risk-driven volatility levels, market participants prefer to avoid the heat by staying away. However, both of these indices are trading below Nifty’s PE in terms of valuation. This suggests that if financial performance improves, there is room for prices to catch up.
Expert: Shikha Mehta, Research Analyst, Equitree Capital Advisors
The overall markets have been severely damaged, and individual stocks have experienced declines of between 20 and 75 percent. Only a few businesses have consistently produced strong figures while remaining resilient.
According to Rahul Sharma, Research Head at Equity 99, investors are typically drawn to mid-cap and small-cap stocks. This is because they are expected to expand faster than the industry and economy. In spite of a better global economy and a decline in petroleum and commodity prices, he continued, “This industry stayed almost on flat tone.”
NSE’s Nifty50 is trading at a CY23 P/E of 18.7X, while Nifty Midcap and Nifty Smallcap are both trading at 22.2X and 16.4X, respectively, according to Vinit Bolinjkar, Head of Research at Ventura Securities. YTD flat gains decreased the Nifty Smallcap’s valuation, but the Nifty Midcap is remained overvalued.
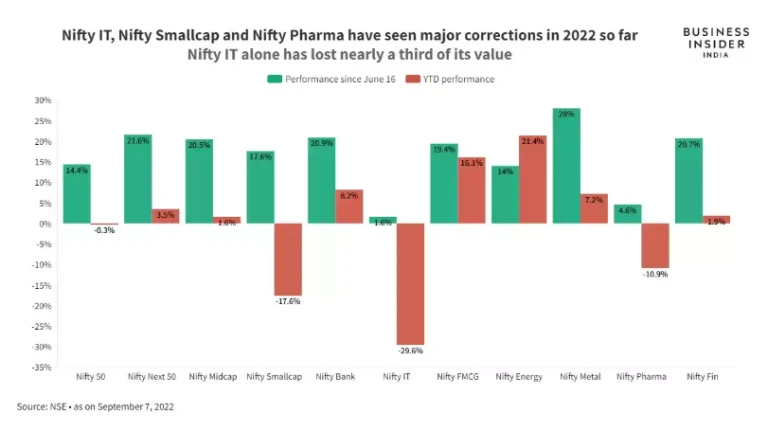
NSE’s Performance: Year Ender 2022
Here are some results that caught our attention:
- The weakest performer was Nifty IT TRI, which returned -17.1.
- The NIFTY Midcap150 Quality 50 – TRI, with a return of -5.4, is the biggest surprise (in my opinion). The 7th worst performer is this one! Compared to Nifty Midcap 150 – TRI, which has a 5.45% yield. That gap is significant! Investors must understand that the quality component has an arbitrary definition and will occasionally be prone to poor sequences of returns, despite the fact that active mid-cap mutual funds struggle to outperform the quality index.
- Momentum 30 for the Nifty 200: TRI: -2.8% As we had previously demonstrated, momentum indexes are negatively impacted by a lack of market momentum.
- With a 3.6% return, NIFTY NEXT 50 – TRI was able to maintain its positive trend, but it lagged behind Nifty 50 TRI’s 7%.
- TRI 6.4% for Nifty100 Low Volatility 30. This situation calls for the same caution that was advised for the quality element (or any other factor).
- Equal Weight Nifty100 TRI 4.5% vs. NIFTY 100 TRI 6.4%
- TRI 9.9% for NIFTY50 Equal Weight vs. TRI 7% for Nifty 50. Therefore, active fund managers had a chance to outperform the Nifty 50. (which heavily depends on the top few stocks).
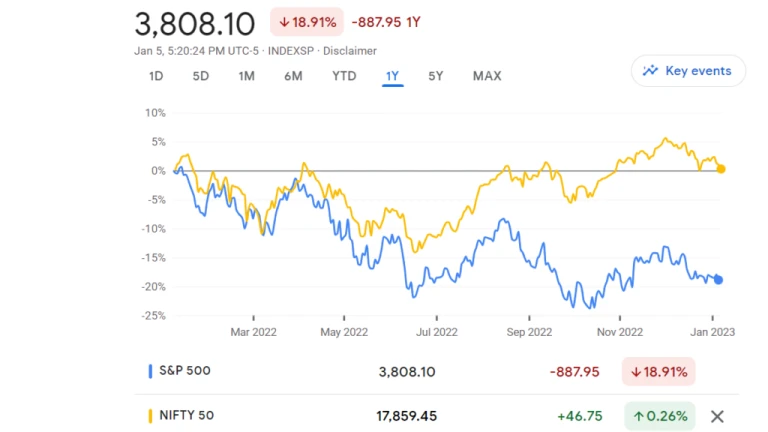
Comparing NSE and S&P 500 2022 Performances
India’s stocks outpaced their US counterparts, helped by stronger economic outlooks and exceptional earnings growth.
Mayank Khemka, chief investment officer for India at Deutsche Bank, stated in an interview that “Indian macroeconomic are blazing on all cylinders,” citing economic data ranging from electricity and gasoline consumption to auto sales. “All of this activity must have an impact on business performance. From here, market expectations should be consistent with earnings growth, which is anticipated to reach double digits” he said in August of 2022.
The Indian stock market, which has been boosted by an unparalleled retail investing boom amid this year’s global share crash, is gaining momentum as international investors start to return after a record departure. The NSE Nifty 50 Index, which has increased by roughly 10% over the past month, has outperformed all other significant Asian benchmarks.
Since the end of June, foreign investors have purchased Indian shares for a net $3.2 billion. The Federal Reserve’s aggressive tightening policy worries raised the dollar. This caused outflows from emerging-market assets of around $33 billion over the preceding nine months. This in turn led to a decline in those assets.
Follow us on Instagram: @InvestWhat