Understanding Gann Theory in Stock Market
For traders and investors, understanding Gann Theory can be a great way to anticipate market movements. The theory was developed by W.D. Gann, an American stock trader who used it to predict price movements in the stock market in the 1920s. Gann Theory is based on using mathematics, geometry and astrology to identify key support and resistance levels in markets. These levels are crucial for traders as they provide important information about when to enter and exit trades. In this article, we will explore Gann Theory in more detail, so you understand how it works and why it is an important tool for traders today.
What is Gann Theory?
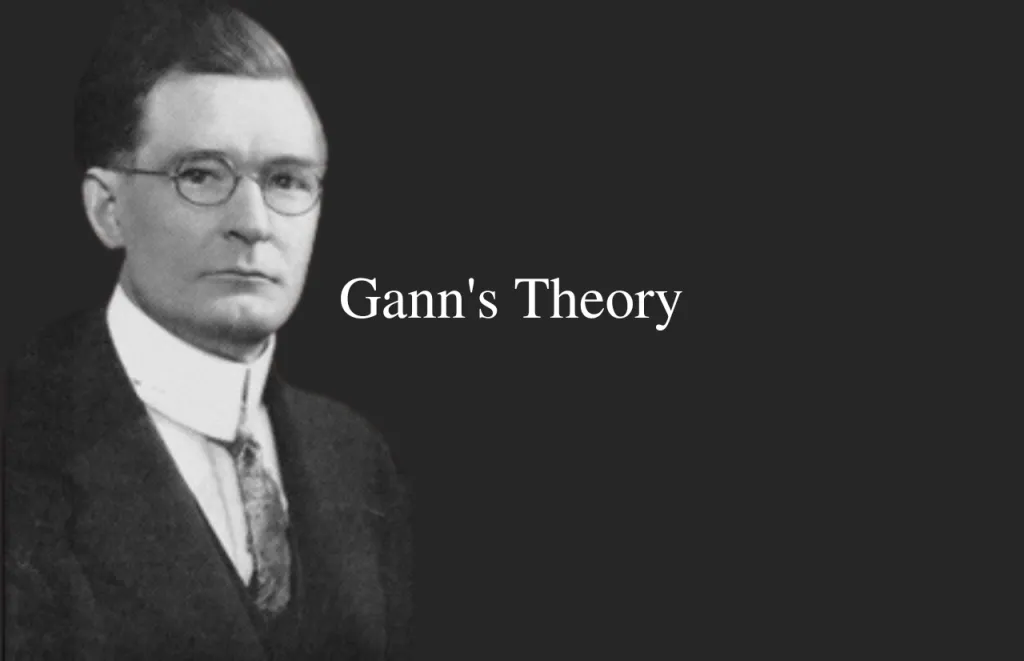
William D. Gann developed the Gann theory in the 1900s. He was a successful trader who believed that stock prices fluctuated in an oblique manner. An asset can move in various directions. He noticed that price changes were related to natural geometric shapes and forecasted future price movements with respect to time. As a result, Gann theory is also known as the “Gann Angle theory.”
Gann trading strategy can still be used and, when used correctly, can predict an asset’s movement with up to 90% accuracy. W. D. Gann believed in a natural time cycle for the market. Natural geometric shapes and ancient mathematics were the foundations of his theory. The patterns and angles of a market asset, according to Gann theory. Can be used to forecast the price’s future movements.
What are Gann Angles?
W.D. Gann pioneered several techniques for analyzing price charts. Gann believes that each angle and pattern has distinct characteristics that can be used to forecast price movement. The time and price intervals on Gann’s charts are the same.
Rice/run of 1×1 will always equal 45-degree angle for Gann Angles. According to Gann, when price and time rise or fall at a 45 degree angle relative to each other, they are at their best.
You must have a significant top or bottom to draw Gann Angles at different angles. A bullish market exists when prices are above the trendline. If they are below, it is a bear market.
1) 1 x 8 – 82.5 degrees
2) 1 x 4 – 75 degrees
3) 1 x 3 – 71.25 degrees
4) 1 x 2 – 63.75 degrees
5) 1 x 1 – 45 degrees
6) 2 x 1 – 26.25 degrees
7) 3 x 1 – 18.75 degrees
8) 4 x 1 – 15 degrees
9) 8 x 1 – 7.5 degrees
Gann observed that all angles provide trend-based support and resistance levels. The 1 x 1 provides excellent support. When the price begins to fall below the 1×1 angled trend line, it is a major indicator of a reversal.
Basics of Gann theory
You can quickly grasp the fundamentals of the subject by using Gann angles Intraday trading using the Gann Theory. To grasp the concept, consider the following example. If the market is in an uptrend and does not break, it means that the market will continue to rise until the angle trend line breaks.
Gann theory can assist traders in making good returns on the market. There are numerous Gann theory books available online and in bookstores. You can use the books to help you trade. We have covered the fundamentals of Gann Theory application.
Application of Gann theory
Price theory and Gann time can both be used to study patterns.
- Price Analysis Gann angles can be used to track the price movements of stocks. The pivot levels are used to forecast the stock’s price movements in the future. Resistance and support levels can also influence the stock price.
- Time Management. Gann’s time study model predicts when the stock’s value will reverse. It is necessary to examine historical data and determine the current price of the stock. Gann’s time study theory enables traders to forecast when a stock’s price will fall. To estimate this, the stock price movements over various time periods must be examined.
- Pattern Analysis. The use of patterns can aid in the detection of stock movements and investor activity. The pattern study examines the trends and patterns that indicate a stock movement reversal.
How to use Gann trading strategy
Gann created this trading strategy based on the assumptions.
1) The stock market is governed by a time cycle.
2) Markets have a geometric design and movement.
3) The only factors influencing a market are price, time, and range.
Traders should keep in mind that the market moves in different directions. These angles will remain constant. These angles are only rotateable.
An asset can shift from one angle to another. The “Rule of All Angles” governs this. This rule states that once an asset has achieved an angle, it moves from one angle to another. Gann angles are most commonly used to locate support and resistance lines.
When support is broken, it is referred to as a break. This suggests that the price will fall. On the other hand, it erupts. This indicates that resistance has been broken and that the price will fall.
Once a trader has determined his or her time frame, the Gann angles will be drawn on the stock chart. These angles can be 1X1, 2X1, 3,X1, 3X1, 1,X2, 1,X3, etc. These lines can be used to determine the trader’s need and then used to interpret price movement.
Up trending support angles indicate support, while down trending support angles indicate resistance.
A combination of horizontal and angles is sometimes used to determine support or resistance. If a stock is bullish, it may retrace 50% of its previous gains. This level will act as a support level for the stock.
If the stock is bearish, the 50% retracement level is a key resistance level. These angles serve as important support and resistance levels for assets trading at various angles. These areas are also referred to as price clusters.
Follow us on Instagram.