How to Read a Company's Balance Sheet in 15 Minutes

After decades of poring over financial statements, I can tell you one thing with certainty: the balance sheet never lies. It is the single most honest document a company will ever produce, and once you learn to read it, you will never look at a business the same way again.
Most investors spend the majority of their time on earnings reports and revenue growth, chasing the income statement like it holds all the answers. And while the income statement tells you how a company performed over a period, the balance sheet tells you something far more enduring — what a company actually is at this exact moment in time. Think of it as a financial photograph taken on a single day, usually the last day of a quarter or fiscal year.
What is a Balance Sheet?
A balance sheet is a financial statement that shows a company’s financial position at a specific point in time. It reflects what the company owns (assets), what it owes (liabilities), and the residual value for shareholders (owners’ equity), which together determine the company’s “book value.” By organizing these components in a structured format, the balance sheet provides a clear snapshot of the company’s financial health.
This statement is typically prepared at regular intervals—such as quarterly or monthly—depending on regulatory requirements and internal policies. Since it captures financial data as of a particular date (the reporting date), it helps investors, analysts, and management assess stability, liquidity, and overall financial strength at that moment.
The Core Equation You Must Never Forget
Everything on a balance sheet flows from one foundational equation that has remained unchanged for centuries of accounting history.
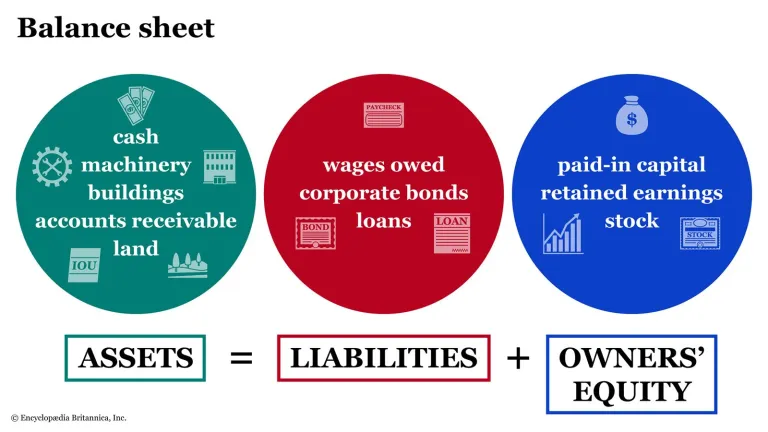
Assets = Liabilities + Shareholders' Equity
That is it. That is the entire logic of the document, and every number you encounter on those pages is either a component of the left side or the right side of that equation.
Component | What It Means |
|---|---|
Assets | Everything the company owns or controls that has economic value |
Liabilities | Everything the company owes to creditors, suppliers, and lenders |
Equity | What remains for shareholders after all liabilities are paid off |
Keep this equation in mind as an anchor because it keeps you from getting lost in the details. So, let us understand how to effectively read a balance sheet in 15 minutes.
Start With the Assets Section
Assets are always listed from most liquid to least liquid, and this ordering is intentional and meaningful.
Asset Type | Examples | Timeframe |
|---|---|---|
Current Assets | Cash, receivables, inventory | Convertible within 1 year |
Non-Current Assets | Property, equipment, goodwill, patents | Long-term holdings |
The first question I always ask when looking at the current assets section is whether the company has enough cash and near-cash assets to handle its short-term obligations comfortably. A company sitting on a mountain of cash while carrying modest debt is in a fundamentally different position from one with thin cash balances and heavy near-term maturities, even if their revenue figures look identical.
Pay close attention to accounts receivable. This figure represents money owed to the company by its customers for goods or services already delivered. If receivables are growing much faster than revenue, it often signals that the company is either struggling to collect payments or extending overly generous credit terms to boost reported sales, neither of which is a healthy sign.
Inventory deserves special scrutiny in manufacturing and retail businesses. A rising inventory-to-revenue ratio often means products are not moving as fast as management would like you to believe.
The Liabilities Section Tells You Who Owns a Piece of the Future
Liabilities, like assets, are split into current and non-current obligations.
Liability Type | Examples |
|---|---|
Current Liabilities | Accounts payable, short-term debt, accrued expenses |
Non-Current Liabilities | Long-term bonds, pension obligations, deferred taxes |
The relationship between current assets and current liabilities is one of the first ratios worth calculating, known as the current ratio. You simply divide current assets by current liabilities. A ratio comfortably above 1 tells you the company can meet its near-term obligations without breaking a sweat. A ratio below 1 does not necessarily spell disaster, but it warrants a closer look at the quality of those assets and the predictability of the company's cash flows.
Long-term debt is where many investors either relax too quickly or panic unnecessarily. The number on its own means very little. What matters is debt in relation to the company's earnings power, typically measured as debt divided by EBITDA. A capital-intensive industrial business carrying debt at three times EBITDA might be perfectly healthy, while a consumer startup at the same level could be in serious trouble. Context is everything.
Shareholders' Equity Is Where the Story Gets Interesting
This section is often the most overlooked by casual readers, and that is a mistake.
Equity Component | What to Look For |
|---|---|
Retained Earnings | Cumulative profits kept inside the business over its history |
Common Stock & APIC | Capital raised from shareholders through stock issuance |
Treasury Stock | Shares bought back, recorded as a negative, reduces equity |
A large retained earnings balance is generally a signal of a profitable business that has been compounding capital effectively over time. Heavy share repurchases are not inherently good or bad, but they do affect equity per share meaningfully, so always factor this in when evaluating book value.
A negative total equity figure can look alarming at first glance, but it is not always a death sentence. Some excellent businesses deliberately maintain negative equity through aggressive buybacks and debt financing, but this strategy only works so long as cash flows remain strong and predictable.
Four Numbers Worth Calculating in Under Five Minutes
Once you have scanned through the three sections, run through these four calculations quickly. They give you a structured view of the company's financial health without needing a spreadsheet.
Ratio | Formula | What It Tells You |
|---|---|---|
Current Ratio | Current Assets / Current Liabilities | Short-term liquidity; above 1.5 is comfortable |
Debt-to-Equity | Total Debt / Total Equity | How much is financed through debt vs owner funding |
Return on Equity | Net Income / Average Equity | How efficiently management deploys shareholder capital |
Book Value Per Share | Total Equity / Shares Outstanding | A rough anchor for intrinsic value |
Consistently high return on equity sustained over many years is one of the strongest markers of an exceptional business. Book value per share, for asset-light or intangible-heavy companies, should be treated as a floor rather than a ceiling.
What the Balance Sheet Cannot Tell You
After all these years, one of the most valuable lessons I have learned is that the balance sheet is a starting point, not a conclusion. It captures a single point in time and reflects historical cost accounting rather than current market values. A piece of real estate purchased decades ago sits on the books at its original cost, not at what it would fetch today.
Brand value, employee talent, customer relationships, and competitive moats do not appear anywhere in this document unless they were explicitly acquired through a transaction. Some of the most valuable companies in the world have relatively modest balance sheets precisely because their true worth lies in things that accounting conventions cannot easily capture.
This is why reading the balance sheet in isolation is a habit to avoid. Always pair it with the income statement to understand the earnings engine, and with the cash flow statement to verify that the reported profits are actually translating into real money flowing into the business.
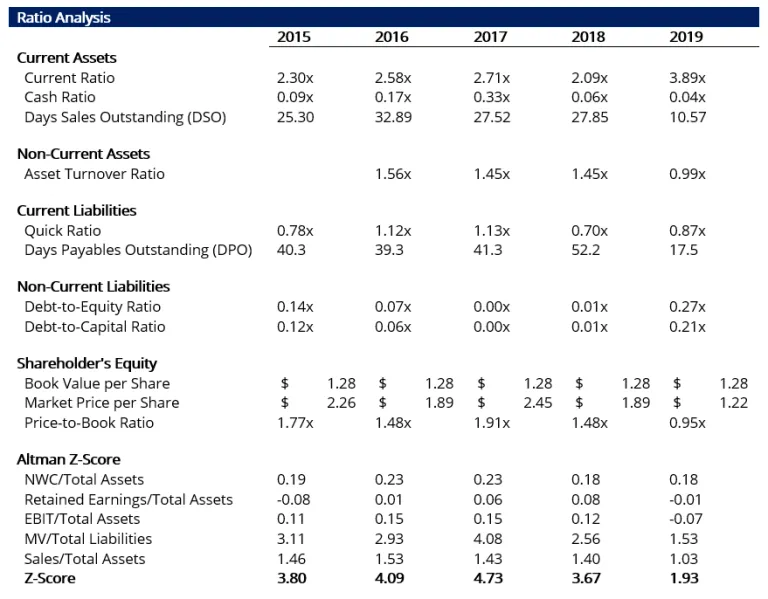
Ratio Analysis
The company’s ratio analysis shows a mixed financial performance over the period. Liquidity appears inconsistent, with the current ratio improving overall but fluctuating in between, while the cash ratio remains very low, indicating limited immediate cash availability. Efficiency metrics such as Days Sales Outstanding (DSO) and Asset Turnover suggest some improvement in receivables management but a decline in asset utilization in later years. On the liabilities side, leverage remains relatively low, as reflected in modest debt-to-equity and debt-to-capital ratios, though a slight increase toward the end signals rising reliance on debt.
From a shareholder perspective, valuation metrics like the price-to-book ratio have declined, indicating reduced market confidence or undervaluation over time. Profitability indicators within the Altman Z-score components weaken significantly in the later years, with the overall Z-score dropping sharply, signaling potential financial distress risk. Overall, while the company maintains low leverage, weakening efficiency and declining financial health indicators raise concerns about its sustainability.
Putting It All Together in 15 Minutes
Here is the exact sequence to follow every time you sit down with a balance sheet for the first time.
Start by quickly scanning the balance sheet to understand the company’s overall size, total assets, and debt levels. Check whether equity is positive and growing, as this gives a basic sense of financial stability. Then compare current assets with current liabilities to evaluate liquidity, as this helps you judge whether the company can meet its short-term obligations comfortably.
Next, look at long-term liabilities and assess when they are due, along with whether the company’s cash flows are strong enough to service them. Move to the equity section to observe trends in retained earnings and any changes in treasury stock, which can signal profitability and capital allocation decisions. Finally, calculate key financial ratios and compare them with previous years to identify trends and shifts in the company’s financial health.
Trends are where the real story lives. A single data point in isolation is almost meaningless; it is the direction of travel over multiple periods that tells you whether a business is getting stronger or quietly deteriorating.
A balance sheet rewards patience and pattern recognition more than any other financial document. The more of them you read across different companies, industries, and economic environments, the faster your eye moves to the numbers that matter — and the sooner you will sense something is off before the market does.